BTC/USD Touches $40,855 Daily High

Bitcoin Price Prediction – May 26
The Bitcoin price has been increasing since a couple of days ago but was rejected as soon as it touches the $40,855 resistance level.
BTC/USD Long-term Trend: Bearish (Daily Chart)
Key levels:
Resistance Levels: $47,000, $49,000, $51,000
Support Levels: $32,000, $30,000, $28,000
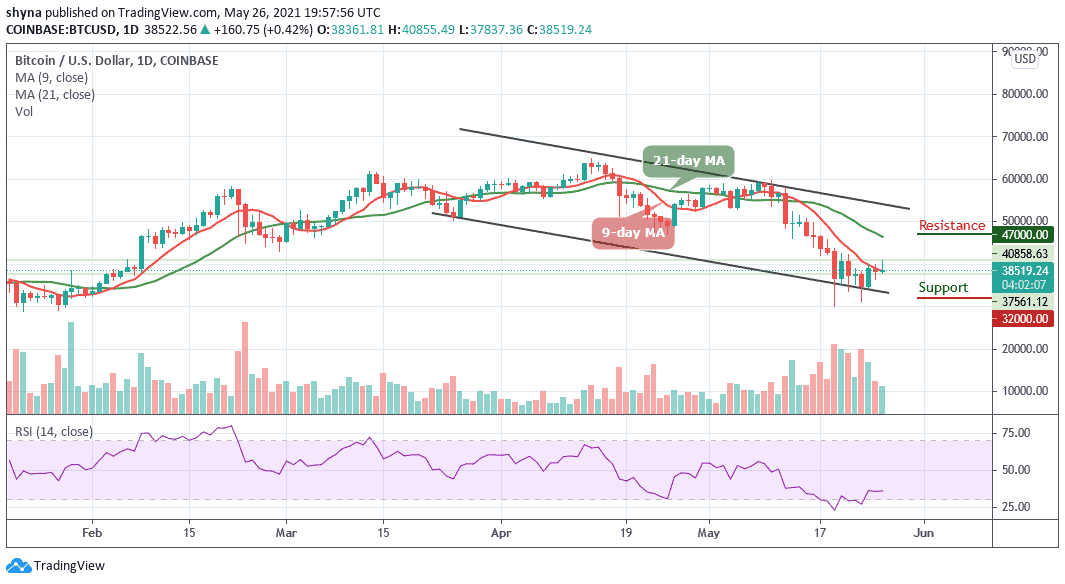
After closing at $38,361 yesterday, BTC/USD gained pace above the $40,500 resistance level today as the king coin failed to settle above this level, sliding below the 9-day moving average. The Bitcoin price begins a downside correction and it is currently trading around the $38,519 level. Therefore, if there is a proper daily close above $40,000, the Bitcoin price might start a steady increase in the coming sessions.
Bitcoin Price Prediction: Will BTC Break above $41,000 Resistance?
Ahead of the bullish movement lie the nearest resistance at $42,000, where the coin may reach or surpasses but the trend could turn down after testing the above resistance. Therefore, if the bullish momentum continues, the Bitcoin price may further fly across the 21-day moving average to reach the resistance levels at $47,200, $49,000, and $51,000.
On the downside, the seller may encounter supports at $32,000, $30,000, and $28,000 should in case the Bitcoin price crosses below the lower boundary of the channel. However, the sideways movement is been revealed on the daily chart as the Relative Strength Index (14) keeps moving in the same direction below 40-level. Meanwhile, if the market price drops, definitely the technical indicator may turns more bearish.
BTC/USD Medium – Term Trend: Bearish (4H Chart)
Since the Bitcoin price falls from the resistance level of $40,855 a few hours ago, the 9-day and 21-day moving averages have been strong support and resistance levels. Now, if the price crosses above the upper boundary of the channel, BTC/USD may print a new high of around $41,000.
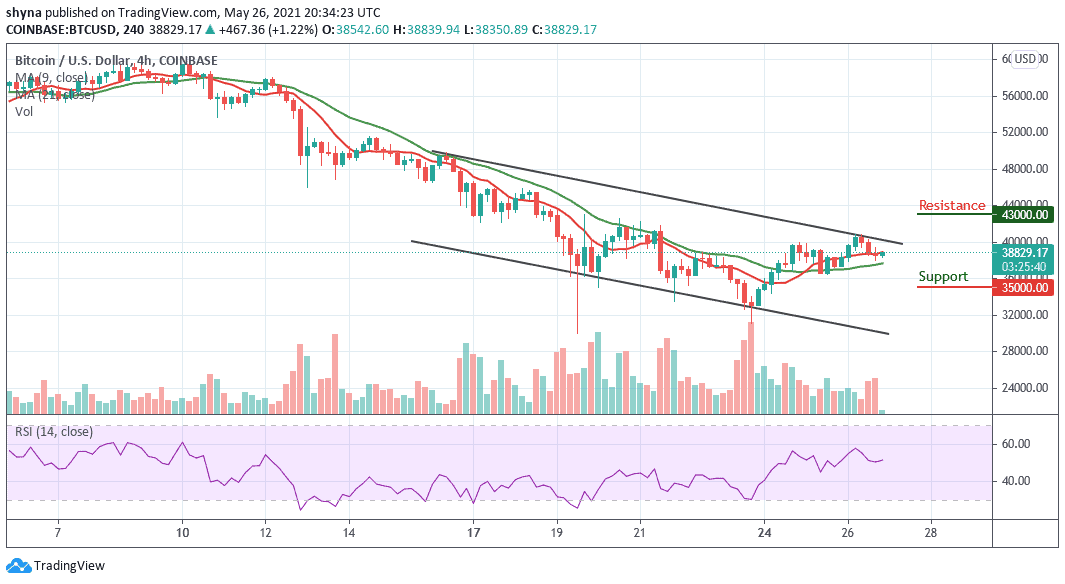
However, the technical indicator Relative Strength Index (14) is seen moving around 50-level, any bullish movement above this level may likely take the Bitcoin price to the resistance level of $43,000 and above. On the contrary, a break below the 21-day moving average could plunge the Bitcoin price to the support level at $35,000 and below.
Source link


