XRP/USD Moves Above $1.00 Level

Ripple Price Prediction – May 26
The Ripple price prediction shows that XRP/USD is currently trading to the upside as the coin moves to cross above the 9-day moving averages.
XRP/USD Market
Key Levels:
Resistance levels: $1.40, $1.50, $1.60
Support levels: $0.60, $0.50, $0.40
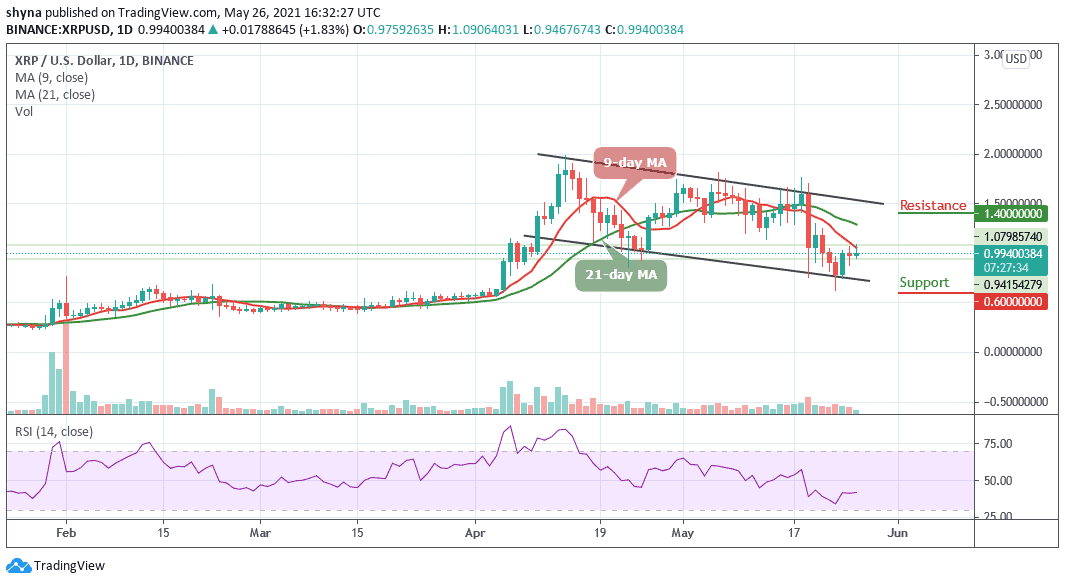
Today, XRP/USD bulls are coming into play as the price crosses above the red-line of the 9-day moving average, rising from $0.97 to $1.09. However, the technical indicator Relative Strength Index (14) is seen moving in the same direction around 42-level. This shows that the daily trend is still bullish while the overall market sentiment may start moving sideways.
Ripple Price Prediction: Can Ripple (XRP) Focus at the Upside?
At the time of writing, the Ripple price is hovering around $0.99 after touching the high of $1.09. A building bullish momentum suggests that XRP/USD may continue to the climb towards critical resistance at $1.00, but from a technical point of view, the Ripple price is currently in the hands of bears, as observed by the technical indicator Relative Strength Index (14) which is hovering around the 42-level. Meanwhile, as the RSI (14) remains below 50-level, the bearish grip may continue to strengthen.
Furthermore, the nearest resistance for the market can be located at $1.40, $1.50, and $1.60 levels. Meanwhile, as seen on the daily chart, there’s a sign of a decisive move that may come to play in the market soonest.
However, if the daily low of $0.9 support weakens, a price break-down may occur as the bears may find additional lows at $0.60, $0.50, and $0.40 support levels.
When compared with Bitcoin, the Ripple price is consolidating within the channel as the red-line of the 9-day moving average is ready to cross below the green-line of the 21-day moving average. Meanwhile, if buyers fail to push the market price above this barrier, XRP/BTC may cross below the lower boundary of the channel to hit the critical support level at 1900 SAT and below.
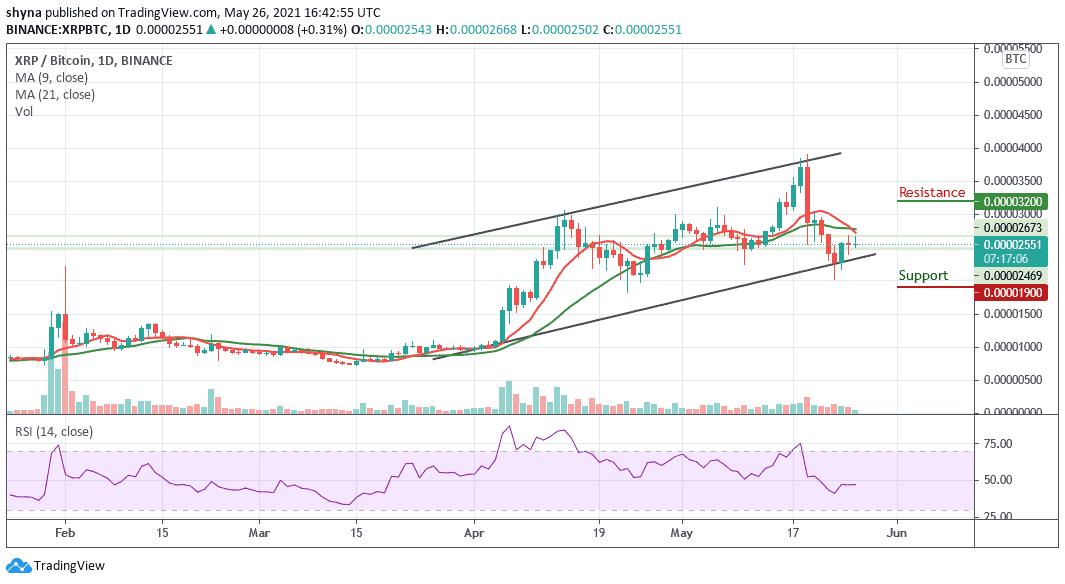
On the contrary, if the bulls make a successful cross above the 9-day and 21-day moving averages, then the Ripple price may experience more uptrends and the nearest resistance levels are located at 3200 SAT and above. Meanwhile, the technical indicator RSI (14) is moving below 50-level, which indicates sideways movement may come to play.
Looking to buy or trade Ripple (XRP) now? Invest at eToro!
75% of retail investor accounts lose money when trading CFDs with this provider
Source link


